

National Approach for Product Improvement
Every step counts! Working together towards an improved product composition by 2030
About the NAPV
Why a National Approach for Product Improvement (NAPV)?
Obesity and chronic diseases are common in the Netherlands: fifty percent of all adults are overweight. That is why we need to make healthy choices easier. The Nutrition Centre's Wheel of Five helps people do this. However, because we also consume products that are not included in the Wheel of Five, the government has developed an approach to improve product compositions in collaboration with nutrition experts; resulting in the NAPV.
Read more about the motivation behind and development of the NAPV on the government's NAPV page (Dutch) (opens in new window), or under more information.
Who is it for?
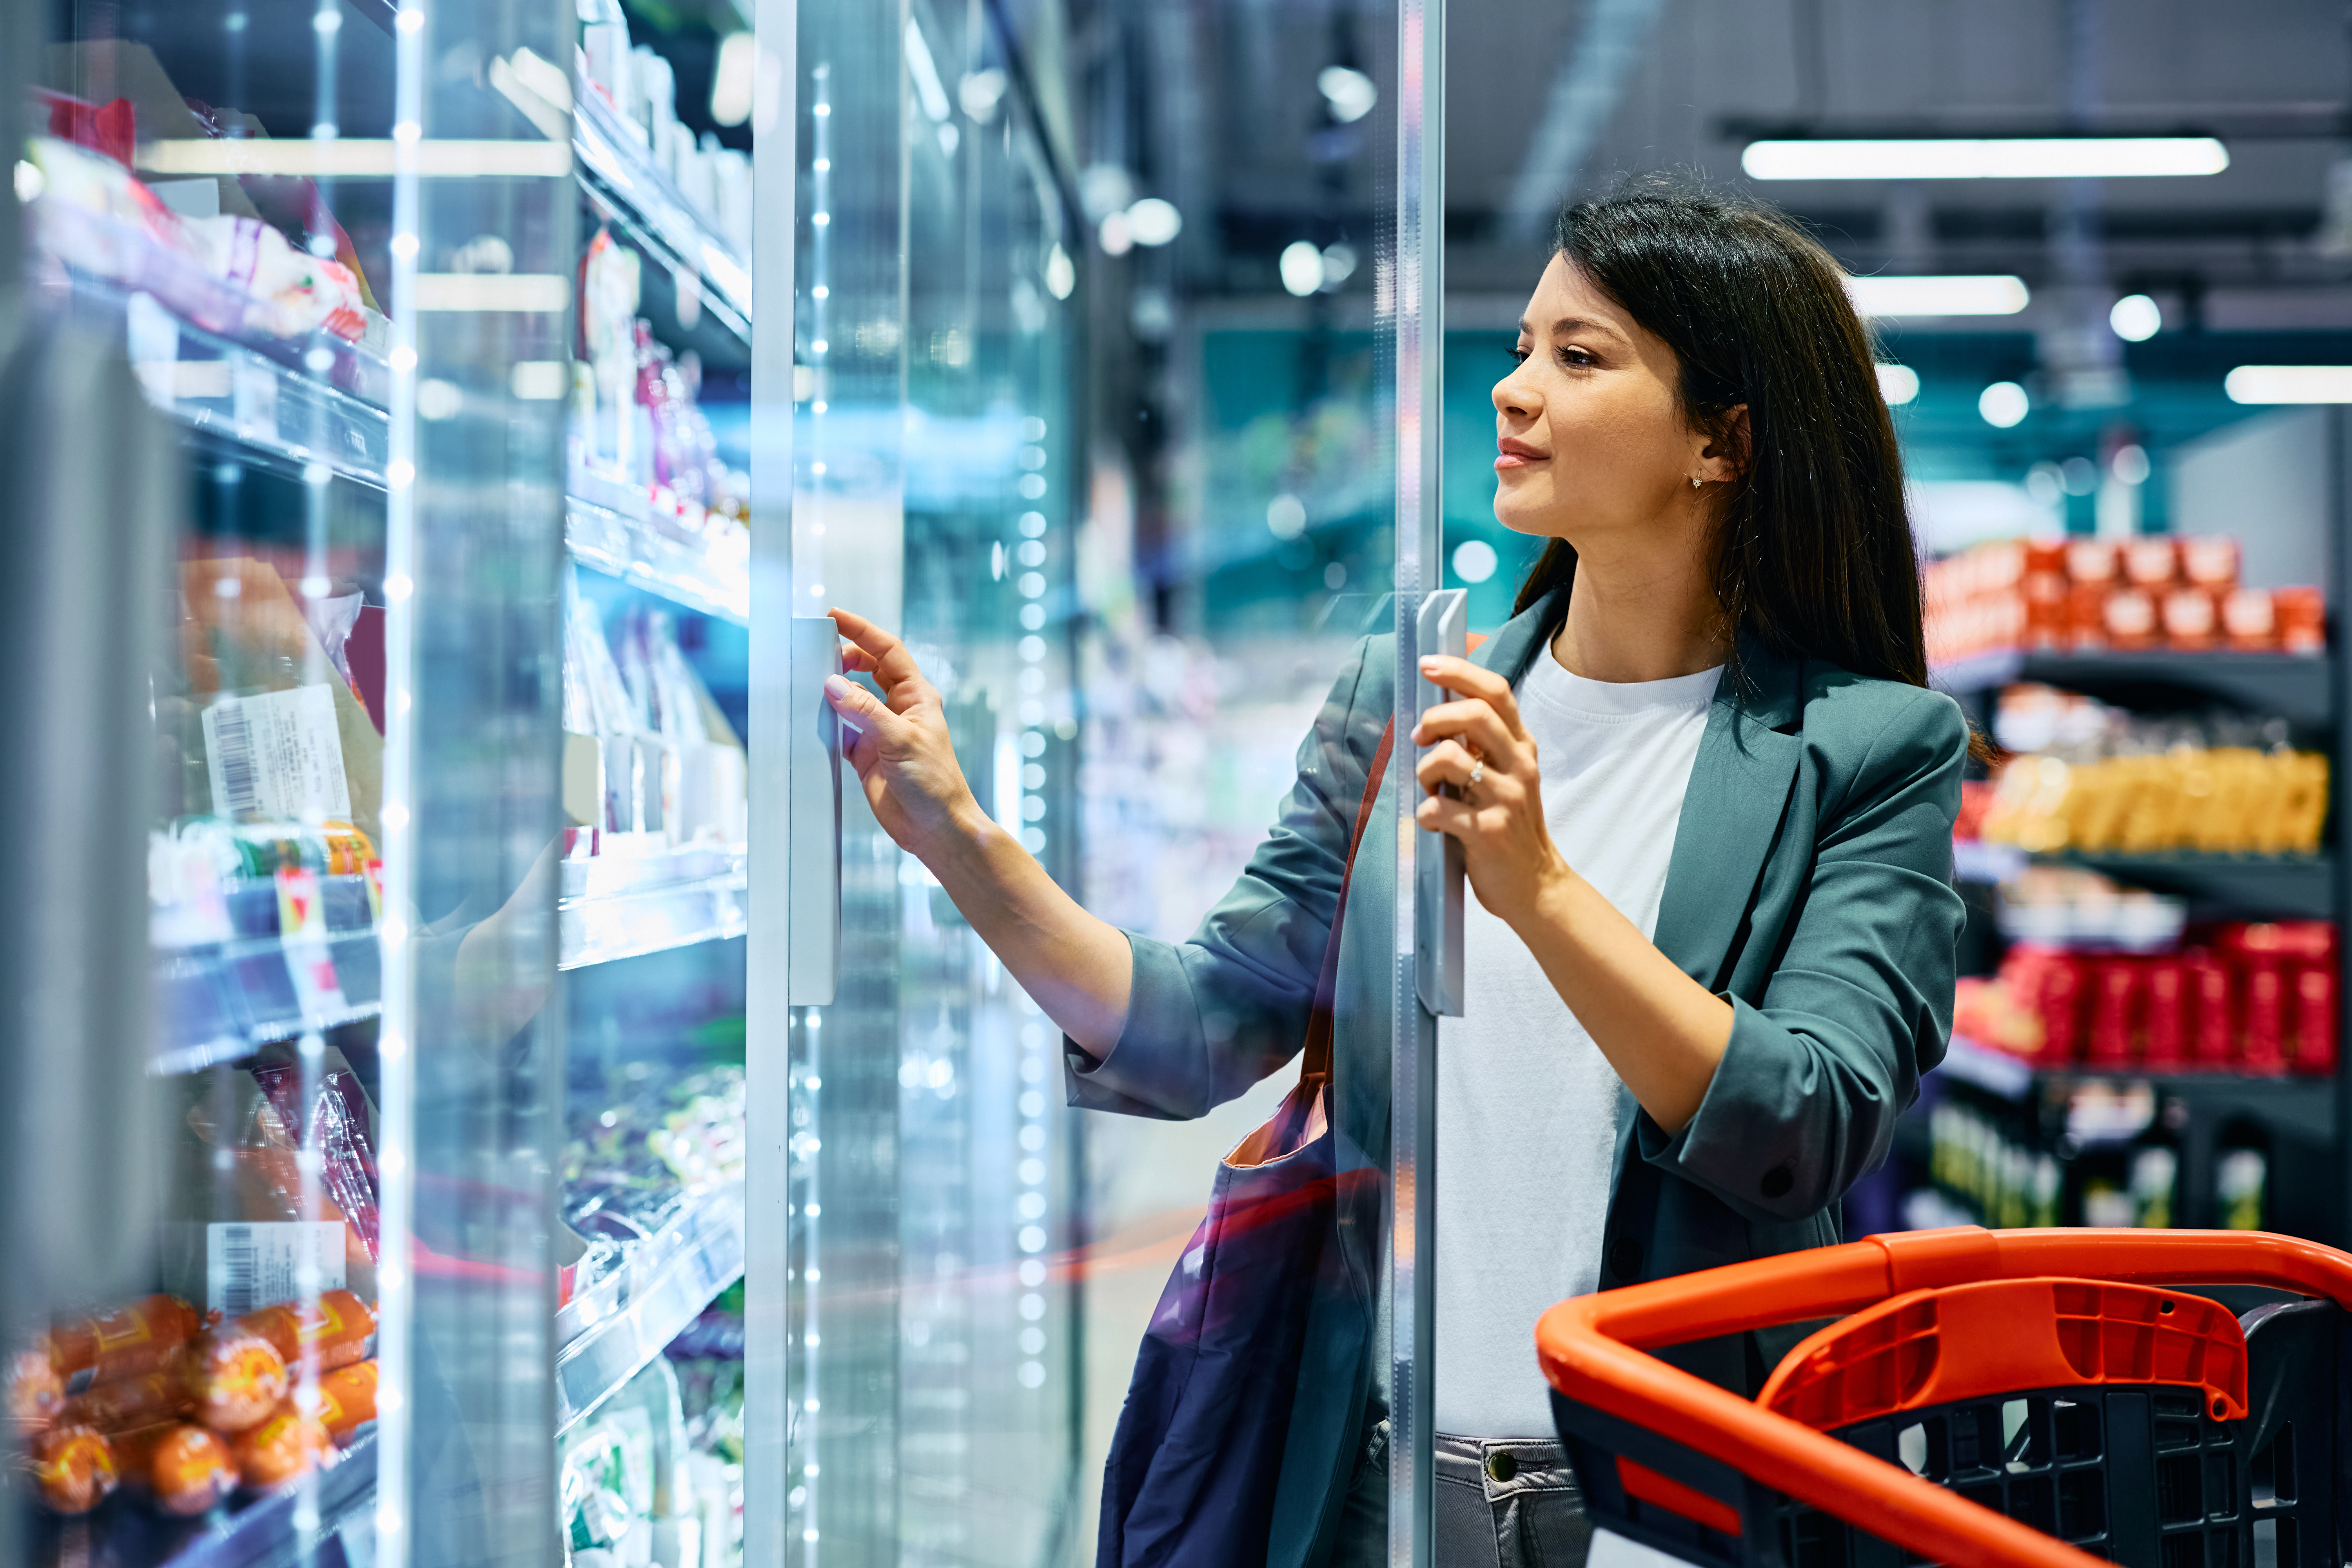
The NAPV is for a broad group of food producers and suppliers, from multinationals to SMEs, from fast-service restaurants to caterers and from supermarkets to wholesalers. The aim is for all these parties to work on improving the food supply by reducing the salt, sugar and saturated fat content in processed products, and increasing the amount of dietary fibre. This will enable retailers, restaurants and catering companies to offer improved processed products.
Would you like to get started with the NAPV or do you need additional information?
The step-by-step plan(download file) (Dutch | PDF | 188 kB) shows you how to proceed. In three steps, we guide you towards plan of action. Each step includes useful tips and links to help you get started, but also to seek out collaborations.
How does the NAPV work?
Product improvement is most effective when the entire food sector collaborates to reduce the levels of salt, sugar and saturated fat in processed products, while increasing the levels of dietary fibre. That is why the government, together with experts, has set threshold values and targets. The RIVM monitors progress using data from the Food Database (LEDA), which companies provide themselves (usually automatically). You can access the data for your own products in the LEDA through the Manufacturers' Access Portal.
The governments infographic(download file) (Dutch | PDF | 660 kB) offers a clear overview of the entire NAPV system, and the additional information section provides links to all available background information.
Threshold values and calculation tool
There are threshold values1 (opens new window, for different product groups. They are calculated per nutrient (salt, sugar, saturated fat and fibre) and have three values: high, medium, and low. This means that each product falls into one of four categories based on the threshold values per nutrient. The highest categories contain products with a high content of this nutrient. Manufacturers can use the threshold values to improve their products step by step (see image).
A fictitious product with incremental threshold values for four nutrients


Tip: Did you know that there is a NAPV calculation tool(download file) (Dutch | XLSX | 38 kB) to rapidly calculate the NAPV categories of your products?
1When setting the product criteria, professionals such as manufacturers, supermarkets, the hospitality industry, caterers, scientists and consumer organisations were asked for advice. For each product group, the technological aspects and what is permitted by law were also considered.
Purchasing tool
Does your company purchase from wholesalers? Did you know that the threshold values listed in the Excel overview (opens new window) (Dutch) can also be used as purchasing criteria? The overview allows you to take the NAPV threshold values into account when placing orders. For example, you can choose to no longer include products with nutrients above a certain threshold for salt, sugar and saturated fat on your menu.
You can also use this overview in Excel (opens new window) (Dutch) if you are responsible for briefing your suppliers about new recipes. The overview allows you to take the NAPV threshold values into account when ordering new products. For example, you can choose not to purchase products with salt, sugar and/or saturated fat above a certain threshold value.

Target for 2030
The target for 2030 is that, for each nutrient, 50% of the products in each product group fall into the most favourable category. Also, only 10% of the products should fall into the least favourable category.
Distribution of products per product group according to the amount of salt, sugar, saturated fat and/ or fibre in 2030:

Insight into progress and data delivery
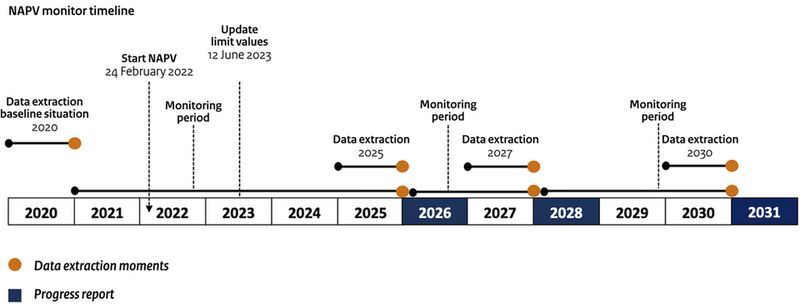
NAPV monitor
Food database (LEDA)
Tips for submitting data

Manufacturers' Access Portal
Food groups
Agreements
Are you a brand owner and not listed here? Would you like to join the agreements? Please register via napv@productverbetering.nl
Potato dishes
Potatoes with meat or fish and vegetables
Salt content:
By 2027, 30% of products will fall into the most favourable category because they have a low salt content (0.54g/ 100g). A maximum of 10% of products will then fall into the least favourable category (0.75g/ 100g). By 2030, the goal is for 50% of products to fall into the most favourable category and a maximum of 10% into the least favourable category.
These agreements are in line with the NAPV objective.
Signed by: Albert Heijn, Aldi, Iglo, Jumbo, Lidl, Sligro, Superunie, Udea.
Potatoes with meat substitute and vegetables
Salt content:
By 2027, 30% of products will fall into the most favourable category because they have a low salt content (0.54g/ 100g). A maximum of 10% of products will then fall into the least favourable category (0.75g/ 100g). By 2030, the target is that 50% of products fall into the most favourable category and a maximum of 10% into the least favourable category.
These agreements are in line with the NAPV objective.
Signed by: Albert Heijn, Aldi, Jumbo, Lidl, Sligro, Superunie, Udea.
Stew with potatoes, vegetables and meat (or meat substitute)
Salt content:
By 2027, 30% of products will fall into the most favourable category because they have a low salt content (0.54g/ 100g). A maximum of 10% of products will then fall into the least favourable category (0.75g/ 100g). By 2030, the target is for 50% of products to fall into the most favourable category and a maximum of 10% into the least favourable category.
These agreements are in line with the NAPV objective.
Signed by: Albert Heijn, Aldi, Jumbo, Lidl, Sligro, Superunie, Udea.
Stew with potatoes and vegetables, without meat (or meat substitute)
Salt content:
By 2027, 30% of products will fall into the most favourable category because they have a low salt content (0.54g/ 100g). A maximum of 10% of products will then fall into the least favourable category (0.75g/ 100g). By 2030, the target is for 50% of products to fall into the most favourable category and a maximum of 10% into the least favourable category.
These agreements are in line with the NAPV objective.
Signed by: Albert Heijn, Aldi, Jumbo, Lidl, Sligro, Superunie, Udea.
Sauerkraut stew
Salt content:
By 2025, 50% of products will fall into the most favourable category because they have a low salt content (0.84g/ 100g). A maximum of 10% of products will then fall into the least favourable category (1.0g/ 100g).
These agreements are in line with the NAPV objective.
Signed by: Albert Heijn, Aldi, Jumbo, Lidl, Sligro, Superunie, Udea.

Potato dishes
Salt content

Ready-made meal components
Potato dish
Salt content:
By 2025, 50% of products will fall into the most favourable category because they have a low salt content (0.87g/ 100g). A maximum of 10% of products will then fall into the least favourable category (1.2g/ 100g).
These agreements are in line with the NAPV objective.
Signed by: Albert Heijn, Aldi, Iglo, Jumbo, Lidl, Sligro, Superunie, Udea
Meat or meat substitute dish, without carbohydrate component
Salt content:
By 2027, 30% of products will fall into the most favourable category because they have a low salt content (0.87g/ 100g). A maximum of 10% of products will then fall into the least favourable category (1.2g/ 100g). By 2030, the target is for 50% of products to fall into the most favourable category and a maximum of 10% into the least favourable category.
These agreements are in line with the NAPV objective.
Signed by: Albert Heijn, Aldi, Iglo, Jumbo, Lidl, Sligro, Superunie, Udea.
Ragout
Salt content:
By 2027, 50% of products will fall into the most favourable category because they have a low salt content (0.87g/ 100g). A maximum of 10% of products will then fall into the least favourable category (1.2g/ 100g).
These agreements are in line with the NAPV objective.
Signed by: Albert Heijn, Aldi, Jumbo, Lidl, Sligro, Superunie, Udea.
Legume-based dish
Salt content:
By 2027, 30% of products will fall into the most favourable category because they have a low salt content (0.45g/ 100g). A maximum of 10% of products will then fall into the least favourable category (1.0g/ 100g). By 2030, the target is for 50% of products to fall into the most favourable category and a maximum of 10% into the least favourable category.
These agreements are in line with the NAPV objective.
Signed by: Albert Heijn, Aldi, Jumbo, Lidl, Sligro, Superunie, Udea.
Vegetable dish
Salt content:
By 2027, 40% of products will fall into the most favourable category because they have a low salt content (0.39g/ 100g). A maximum of 10% of products will then fall into the least favourable category (0.62g/ 100g). By 2030, the goal is for 50% of products to fall into the most favourable category and a maximum of 10% into the least favourable category.
These agreements are in line with the NAPV objective.
Signed by: Albert Heijn, Aldi, Jumbo, Lidl, Sligro, Superunie, Udea

Ready-made meal
components
Salt content
Rice dishes
Nasi or rice dish
Salt content:
By 2027, 30% of products will fall into the most favourable category because they have a low salt content (0.50g/ 100g). A maximum of 10% of products will then fall into the least favourable category (0.83g/ 100g). By 2030, the goal is for 50% of products to fall into the most favourable category and a maximum of 10% into the least favourable category.
These agreements are in line with the NAPV objective.
Signed by: Albert Heijn, Aldi, Iglo, Jumbo, Lidl, Sligro, Superunie, Udea.
Curry dish with meat (substitute) and sauce, served with rice
Salt content:
By 2025, 50% of products will fall into the most favourable category because they have a low salt content (0.50g/ 100g). A maximum of 10% of products will then fall into the least favourable category (0.83g/ 100g).
These agreements are in line with the NAPV objective.
Signed by: Albert Heijn, Aldi, Iglo, Jumbo, Lidl, Sligro, Superunie, Udea
Rice dish without side dish
Salt content:
By 2025, 50% of products will fall into the most favourable category because they have a low salt content (0.86g/ 100g). A maximum of 10% of products will then fall into the least favourable category (1.0g/ 100g).
These agreements are in line with the NAPV objective.
Signed by: Albert Heijn, Aldi, Jumbo, Lidl, Sligro, Superunie, Udea
Sushi
Salt content:
By 2027, 30% of products will fall into the most favourable category because they have a low salt content (0.96g/ 100g). A maximum of 10% of products will then fall into the least favourable category (1.3g/ 100g). By 2030, the target is for 50% of products to fall into the most favourable category and a maximum of 10% into the least favourable category.
These agreements are in line with the NAPV objective.
Signed by: Albert Heijn, Aldi, Jumbo, Lidl, Sligro, Superunie, Udea.
Other grain based dishes
Salt content:
By 2027, 50% of products will fall into the most favourable category because they have a low salt content (0.50g/ 100g). A maximum of 10% of products will then fall into the least favourable category (0.83g/ 100g).
These agreements are in line with the NAPV objective.
Signed by: Albert Heijn, Aldi, Jumbo, Lidl, Sligro, Superunie, Udea

Rice dishes
Salt content
Pasta and noodle dishes
Pasta dish with tomato sauce
Salt content:
By 2030, 50% of products will fall into the most favourable category because they have a low salt content (0.45g/ 100g). A maximum of 10% of products will then fall into the least favourable category (0.68g/ 100g).
These agreements are in line with the NAPV objective.
Signed by: Albert Heijn, Aldi, Iglo, Jumbo, Lidl, Sligro, Superunie, Udea.
Pasta dish with sauce (not tomato sauce)
Salt content:
By 2030, 50% of products will fall into the most favourable category because they have a low salt content (0.45g/ 100g). A maximum of 10% of products will then fall into the least favourable category (0.68g/ 100g).
These agreements are in line with the NAPV objective.
Signed by: Albert Heijn, Aldi, Jumbo, Lidl, Sligro, Superunie, Udea.
Pasta or noodle dish without side dish and/or sauce
Salt content:
By 2027, 50% of products will fall into the most favourable category because they have a low salt content (0.82g/ 100g). A maximum of 10% of products will then fall into the least favourable category (0.98g/ 100g).
These agreements are in line with the NAPV objective.
Signed by: Albert Heijn, Aldi, Iglo, Jumbo, Lidl, Sligro, Superunie, Udea
Lasagne or other pasta oven dishes
Salt content:
By 2030, 50% of products will fall into the most favourable category because they have a low salt content (0.63g/ 100g). A maximum of 10% of products will then fall into the least favourable category (0.85g/ 100g).
These agreements are in line with the NAPV objective.
Signed by: Albert Heijn, Aldi, Iglo, Jumbo, Lidl, Sligro, Superunie, Udea.
Noodle dish with side dish and/or sauce
Salt content:
By 2027, 40% of products will fall into the most favourable category because they have a low salt content (0.74g/ 100g). A maximum of 10% of products will then fall into the least favourable category (0.89g/ 100g). By 2030, the target is for 50% of products to fall into the most favourable category and a maximum of 10% into the least favourable category.
These agreements are in line with the NAPV objective.
Signed by: Albert Heijn, Aldi, Iglo, Jumbo, Lidl, Sligro, Superunie, Udea

Pasta and noodle dishes
Salt content
Milk products and plant-based substitutes
Dairy drinks, yoghurt, quark and custard
Sugar content:
The signatories jointly declare their intention that by 2030, 50% of products will fall into the most favourable category because they have a low content of mono- and disaccharides (sugar) (7.8g/ 100g). A maximum of 10% of products will then fall into the least favourable category (13g/ 100g).
These agreements are in line with the NAPV objective.
Signed by: Albert Heijn, Aldi, Bidfood, Ekoplaza, Jumbo, Lidl, Oatly, Superunie.
Pudding, mousse and desserts
Sugar content:
The signatories jointly declare their intention that by 2030, 50% of products will fall into the most favourable category because they have a low content of mono- and disaccharides (sugar) (15g/ 100g). A maximum of 10% of products will then fall into the least favourable category (22g/ 100g).
These agreements are in line with the NAPV objective.
Signed by: Albert Heijn, Aldi, Bidfood, Ekoplaza, Jumbo, Lidl, Oatly, Superunie.
Pudding, mousse and desserts
Saturated fat content:
The sectors concerned have indicated that signing this objectiveis not feasible due to the combination with the target to reduce sugar. Reducing both saturated fat and sugar results in a different product. According to the parties involved, this overlooks product improvement. The sectors have therefore chosen to focus initially on reducing sugar in puddings, mousses and desserts.
Milk products and plant-based substitutes without sugar, but with sweeteners
How does the NAPV monitor deal with sweeteners?
There are products without free sugars, but with sweeteners. They are considered to be beyond improvement in terms of sugar content. Similar products where product improvement and/ or innovation is possible are in categories 1 to 4.
However, the RIVM wants to include products with sweeteners in the “Milk products and plant-based substitutes” food groups in the monitor. In this way, the NAPV monitor will also be able to map the share of these products in relation to products in categories 1 to 4. The RIVM will include these results in its assessment of progress towards the NAPV targets for categories 1 to 4. It is relevant to add together products sweetened with sweeteners and step 1 (as well). The more detailed Q&A about the NAPV monitor can be found here (opens new window) (Dutch).

Milk products and plant-based substitutes
Sugar content
Saturated fat content
Meat products and preserves
Single-prepared meat products
Salt content:
The signatories jointly declare their mutual intention that by 2030, 50% of products will fall into the most favourable category because they have a low salt content (1.9g/ 100g). A maximum of 10% of products will then fall into the least favourable category (2.5g/ 100g).
These agreements are in line with the NAPV objective.
Signed by: Albert Heijn, Aldi, Bidfood, Jumbo, Kroon Vleeswaren, Lidl, Superunie, Wahid.
Composite meat products, smoked sausage and canned meat in brine
Salt content:
The signatories jointly declare their intention that by 2030, 50% of products will fall into the most favourable category because they have a low salt content (1.8g/ 100g). A maximum of 10% of products will then fall into the least favourable category (2.3g/ 100g).
These agreements are in line with the NAPV objective.
Signed by: Albert Heijn, Aldi, Bidfood, Gepo Vleeswaren, Jumbo, Kroon Vleeswaren, Lidl, Superunie, Wahid.
Saturated fat content:
The signatories jointly declare their intention that by 2030, a maximum of 10% of products will fall into the least favourable category because they have a high saturated fat content (10g/ 100g).
This agreement is a tailor-made agreement in accordance with the NAPV objective.
Signed by: Albert Heijn, Aldi, Bidfood, Gepo Vleeswaren, Jumbo, Kroon Vleeswaren, Lidl, Superunie, Wahid.
Single raw meat products
Salt content:
The signatories jointly declare their intention that by 2030, 50% of products will fall into the most favourable category because they have a low salt content (3.0g/ 100g). A maximum of 10% of products will then fall into the least favourable category (4.8g/ 100g).
These agreements are in line with the NAPV objective.
Signed by: Albert Heijn, Aldi, Bidfood, Jumbo, Lidl, Superunie, Wahid.
Composite raw meat products
Salt content:
The signatories jointly declare their intention that by 2030, 50% of products will fall into the most favourable category because they have a low salt content (3.1g/ 100g). A maximum of 10% of products will then fall into the least favourable category (3.2g/ 100g).
These agreements are in line with the NAPV objective.
Signed by: Albert Heijn, Aldi, Bidfood, Jumbo, Lidl, Slagerij Woorts, Superunie, Wahid.
Saturated fat content:
The signatories jointly declare their intention that by 2030, no more than 10% of products will fall into the least favourable category because they have a high saturated fat content (15g/ 100g).
This agreement is a tailor-made agreement in accordance with the NAPV objective.
Signed by: Albert Heijn, Aldi, Bidfood, Jumbo, Lidl, Slagerij Woorts, Superunie, Wahid.
Filet americain
Salt content:
The signatories jointly declare their intention that by 2030, 50% of products will fall into the most favourable category because they have a low salt content (1.5g/ 100g). A maximum of 10% of products will then fall into the least favourable category (1.9g/ 100g).
These agreements are in line with the NAPV objective.
Signed by: Albert Heijn, Aldi, Bidfood, Jumbo, Lidl, Slagerij Woorts, Superunie, Wahid.
Final agreements will follow in 2026
Final salt agreements will follow in 2026
Salt plays an important technical role in meat products. Using less salt therefore has consequences for the shelf life (“best before date”) and food safety of the product, and the way in which these two factors influence each other.
To determine what is possible, the signatories will investigate for their own brands what the minimum shelf life should be to get the meat products safely from the factory to the consumer's refrigerator. Based on these results, they will be able to better assess the feasibility of the 2030 targets.
The first NAPV monitor with up-to-date data will be published in 2026. After that, all signatories will meet again, led by the NAPV network director, to finalise the agreements.
In addition, Dutch producers indicate that they have no influence on the recipes of certain meat products and preserves that come from other European countries. This applies to products with a protected geographical indication (BGA) or a protected designation of origin (BOB). These European rules protect regional products against counterfeiting. Such products can also be found in supermarkets.
Final saturated fat agreements will follow in 2026
Reducing saturated fat in meat products presents a number of technical challenges, especially when salt must be reduced at the same time.
The signatories are therefore investigating whether it is possible to reduce both the salt and saturated fat content. In doing so, a maximum of 10% of products may fall into the least favourable category in terms of saturated fat. This research is necessary to determine whether the 2030 targets are achievable.
The first NAPV monitor with up-to-date data will be published in 2026. After that, all signatories will meet again, led by the NAPV network director, to finalise the agreements.

Meat products and preserves
Salt content
Saturated fat content
Vleesvervangers
Meat substitutes
Salt content:
By 2030, 50% of products will fall into the most favourable category because they have a low salt content (1.1g/ 100g). A maximum of 10% of products will then fall into the least favourable category (1.7g/ 100g).
These agreements are in line with the NAPV objective.
Signed by: Albert Heijn, Aldi, Bidfood, Beyond Meat, Florentin, Garden Gourmet, Hansel, HelloFresh, Jumbo, Lidl, Maza, Superunie, Udea.

Meat substitutes
Salt content
Smeer- en bereidingsvetten
Pastagerecht met tomatensaus
Zoutgehalte:
In 2030 zal 50% van de producten in de meest gunstige categorie vallen, omdat ze een laag zoutgehalte hebben (0,45g/ 100g). Maximaal 10% van de producten zal dan in de minst gunstige categorie vallen (0,68g/ 100g).
Deze afspraken zijn in overeenstemming met NAPV-doelstelling.
Ondertekend door: Albert Heijn, Aldi, Iglo, Jumbo, Lidl, Sligro, Superunie, Udea.
Pastagerecht met saus (geen tomatensaus)
Zoutgehalte:
In 2030 zal 50% van de producten in de meest gunstige categorie vallen, omdat ze een laag zoutgehalte hebben (0,45g/ 100g). Maximaal 10% van de producten zal dan in de minst gunstige categorie vallen (0,68g/ 100g).
Deze afspraken zijn in overeenstemming met NAPV-doelstelling.
Ondertekend door: Albert Heijn, Aldi, Jumbo, Lidl, Sligro, Superunie, Udea.
Pasta- of noedelgerecht zonder bijgerecht en/of saus
Zoutgehalte:
In 2027 zal 50% van de producten in de meest gunstige categorie vallen, omdat ze een laag zoutgehalte hebben (0,82g/ 100g). Maximaal 10% van de producten zal dan in de minst gunstige categorie vallen (0,98g/ 100g).
Deze afspraken zijn in overeenstemming met NAPV-doelstelling.
Ondertekend door: Albert Heijn, Aldi, Iglo, Jumbo, Lidl, Sligro, Superunie, Udea
Lasagne of andere pasta-ovengerechten
Zoutgehalte:
In 2030 zal 50% van de producten in de meest gunstige categorie vallen, omdat ze een laag zoutgehalte hebben (0,63g/ 100g). Maximaal 10% van de producten zal dan in de minst gunstige categorie vallen (0,85g/ 100g).
Deze afspraken zijn in overeenstemming met NAPV-doelstelling.
Ondertekend door: Albert Heijn, Aldi, Iglo, Jumbo, Lidl, Sligro, Superunie, Udea.
Noedelgerecht met bijgerecht en/of saus
Zoutgehalte:
In 2027 zal 40% van de producten in de meest gunstige categorie vallen, omdat ze een laag zoutgehalte hebben (0,74g/ 100g). Maximaal 10% van de producten zal dan in de minst gunstige categorie vallen (0,89g/ 100g). In 2030 is het doel dat 50% van de producten in de meest gunstige categorie valt en maximaal 10% in de minst gunstige categorie.
Deze afspraken zijn in overeenstemming met NAPV-doelstelling.
Ondertekend door: Albert Heijn, Aldi, Iglo, Jumbo, Lidl, Sligro, Superunie, Udea

Smeer- en bereidingsvetten
Salt content
Confectionery and sweets
Cakes
Salt content:
By 2030, 50% of products will fall into the most favourable category because they have a low salt content (0.60g/ 100g). A maximum of 10% of products will then fall into the least favourable category (0.90g/ 100g).
These agreements are in line with the NAPV objective.
Signed by: Albert Heijn, Aldi, Bidfood, Ekoplaza, Jumbo, Lidl, Superunie.
Sugar content:
By 2030, 50% of products will fall into the most favourable category because they have a low sugar content (27g/ 100g). A maximum of 10% of products will then fall into the least favourable category (37g/ 100g).
These agreements are in line with the NAPV objective.
Signed by: Albert Heijn, Aldi, Bidfood, Ekoplaza, Jumbo, Lidl, Superunie.
Saturated fat content:
By 2030, 50% of products will fall into the most favourable category because they have a low sugar content (27g/ 100g). A maximum of 10% of products will then fall into the least favourable category (37g/ 100g).
These agreements are in line with the NAPV objective.
Signed by: Albert Heijn, Bidfood, Ekoplaza, Jumbo, Lidl, Superunie.
Biscuits
Salt, sugar and saturated fat content:
Discussions about biscuits are ongoing. More information will follow in 2026.
Gingerbread
Salt content*:
In 2030, 20% of products will fall into the most favourable category (≤0.38g/ 100g) because they have a low salt content. In addition, 65% of products will fall into category 2 (>0.38 - 0.54g/ 100g) and 10% into category 3 (>0.54g – 0.76g/ 100g). A maximum of 5% of the products will then fall into the least favourable category (>0.76g/ 100g).
*Due to technical limitations (salt often comes from baking salts), we are focusing here on a move from step 3 to step 2.
This is a tailor-made agreement in accordance with the NAPV objective.
Signed by: Albert Heijn, Aldi, Bolletje, Ekoplaza, Jumbo, Lidl, Molkwarderkoeke, Peijnenburg, Superunie.
Lasagne of andere pasta-ovengerechten
Sugar content:
In 2027, 43% of products will fall into the most favourable category because they have a low sugar content (≤37g/ 100g). By 2030, 50% of products will fall into the most favourable category because they have a low sugar content. A maximum of 10% of products will fall into the least favourable category (>41g/ 100g) by 2030.
This is a tailor-made agreement in accordance with the NAPV objective.
Signed by: Albert Heijn, Aldi, Bolletje, Ekoplaza, Jumbo, Lidl, Molkwarderkoeke, Peijnenburg, Superunie.
Cereal, muesli, fruit and energy bars
Salt content:
By 2030, 50% of products will fall into the most favourable category because they have a low salt content (0.33g/ 100g). A maximum of 10% of products will then fall into the least favourable category (0.60g/ 100g).
These agreements are in line with the NAPV objective.
Signed by: Albert Heijn, Bolletje, BitesWeLove, Ekoplaza, Jumbo, Lidl, Superunie, Tasty Basics.
Sugar content:
By 2030, 50% of products will fall into the most favourable category because they have a low sugar content (20g/ 100g). A maximum of 10% of products will then fall into the least favourable category (34g/ 100g).
These agreements are in line with the NAPV objective.
Signed by: Albert Heijn, Aldi, Bolletje, B'tween, BitesWeLove, Ekoplaza, Jumbo, Lidl, Superunie, Tasty Basics.
Saturated fat content:
By 2030, 50% of products will fall into the most favourable category because they have a low saturated fat content (2.6g/ 100g). A maximum of 10% of products will then fall into the least favourable category (7.5g/ 100g).
These agreements are in line with the NAPV objective.
Signed by: Albert Heijn, Bolletje, BitesWeLove, Ekoplaza, Jumbo, Lidl, Superunie, Tasty Basics.
Cakes and pastries
Salt content:
By 2030, 50% of products will fall into the most favourable category because they have a low salt content (0.38g/ 100g). A maximum of 10% of products will then fall into the least favourable category (0.76g/ 100g).
These agreements are in line with the NAPV objective.
Signed by: Albert Heijn, Aldi, Bidfood, Ekoplaza, Jumbo, Lidl, Superunie.
Sugar content:
By 2030, 50% of products will fall into the most favourable category because they have a low sugar content (17g/ 100g). A maximum of 10% of products will then fall into the least favourable category (27g/ 100g).
These agreements are in line with the NAPV objective.
Signed by: Albert Heijn, Bidfood, Ekoplaza, Jumbo, Lidl, Superunie.
Saturated fat content:
By 2030, 50% of products will fall into the most favourable category because they have a low saturated fat content (7.1g/ 100g). A maximum of 10% of products will then fall into the least favourable category (14g/ 100g).
These agreements are in line with the NAPV objective.
Signed by: Albert Heijn, Aldi, Bidfood, Ekoplaza, Jumbo, Lidl, Superunie.
Chocolate
Sugar content:
By 2030, a maximum of 10% of products will fall into the least favourable category because they have a high sugar content (56g/100g).
This agreement is a tailor-made agreement in accordance with the NAPV objective.
Signed by: Albert Heijn, Aldi, Ekoplaza, Jumbo, Lidl, Superunie.
Sweets
Sugar content:
By 2030, 50% of products will fall into the most favourable category because they have a low sugar content (54g/ 100g). A maximum of 10% of products will then fall into the least favourable category (74g/ 100g).
These agreements are in line with the NAPV objective.
Signed by: Albert Heijn, Aldi, Bentasil, Bidfood, Ekoplaza, Jumbo, Katja, King, Läkerol, Lidl, Lonka, Red Band, Sportlife, Superunie, The JellyBean Factory, Venco, Xylifresh.
Sorbet
Sugar content:
By 2030, 50% of products will fall into the most favourable category because they have a low sugar content (22g/ 100g). A maximum of 10% of products will then fall into the least favourable category (27g/ 100g).
These agreements are in line with the NAPV objective.
Signed by: Albert Heijn, Aldi, Ekoplaza, Jumbo, Lidl, Superunie.
Ice cream, dairy/plant-based basic
Sugar content:
By 2030, 50% of products will fall into the most favourable category because they have a low sugar content (22g/ 100g). A maximum of 10% of products will then fall into the least favourable category (27g/ 100g).
These agreements are in line with the NAPV objective.
Signed by: Albert Heijn, Aldi, Ekoplaza, Jumbo, Lidl, Superunie.
Saturated fat content:
By 2030, 50% of products will fall into the most favourable category because they have a low saturated fat content (5.7g/100g). A maximum of 10% of products will then fall into the least favourable category (9.2g/100g).
These agreements are in line with the NAPV objective.
Signed by: Albert Heijn, Aldi, Ekoplaza, Jumbo, Lidl, Superunie.
Ice cream, dairy/plant-based speciality
Sugar content:
By 2030, 50% of products will fall into the most favourable category because they have a low sugar content (22g/ 100g). A maximum of 10% of products will then fall into the least favourable category (27g/ 100g).
These agreements are in line with the NAPV objective.
Signed by: Albert Heijn, Ekoplaza, Jumbo, Lidl, Superunie.
Saturated fat content:
By 2030, 50% of products will fall into the most favourable category because they have a low saturated fat content (5.7g/ 100g). A maximum of 10% of products will then fall into the least favourable category (9.2g/ 100g).
These agreements are in line with the NAPV objective.
Signed by: Albert Heijn, Ekoplaza, Jumbo, Lidl, Superunie.
Sweet sauces
Sugar content:
By 2030, 50% of products will fall into the most favourable category because they have a low sugar content (51g/ 100g). A maximum of 10% of products will then fall into the least favourable category (64g/ 100g).
These agreements are in line with the NAPV objective.
Signed by: Aldi, Bidfood, Jumbo, Lidl, Superunie, Ekoplaza.

Confectionery and sweets
Salt content
Sugar content
Saturated fat content
Pizza, wrap, roti and savoury tart
Pizza with meat (substitute)/ salami/ ham and fruit/ fish or shellfish/ cheese and vegetables
Salt content:
Discussions about salt reduction in pizzas are ongoing. More information will follow in 2026.

Pizza, wrap, roti and savoury tart
Salt content
Planning NAPV Network Director
2027
Cheese
Beverages
Sweet spreads
Wraps, roti and savoury pies
Beverages
Sweet spreads
Wraps, roti and savoury pies
5 November 2026
Bread (substitutes) and breakfast cereals
8 October 2026
Meat preparations
Savoury snacks
Meat products and preserves
Savoury snacks
Meat products and preserves
24 September 2026
Bread (substitutes) and breakfast cereals
17 September 2026
Fish
Soups and broths
Sauces
Soups and broths
Sauces
11 June 2026
Meat preparations
Savoury snacks
Savoury snacks
7 May 2026
Fish
Soups and broths
Sauces
Soups and broths
Sauces
6 November 2025
Pizza
Other/run-off
Other/run-off
11 September 2025
Meat products and preserves
Pizza
Pizza
12 June 2025
Spreading and cooking fats
Meat products and preserves
Meat products and preserves
10 April 2025
Confectionery and sweets
Spreading and cooking fats
Spreading and cooking fats
27 March 2025
Portion size programme for cereal, muesli, fruit and energy bars (exploration of portion sizes)
Confectionery and sweets
Confectionery and sweets
13 February 2025
Milk products and plant-based substitutes
Meat substitutes
Meat substitutes
9 January 2025
Milk products and plant-based substitutesMeat substitutes
*The entire food group will be discussed, including as many related subgroups as possible.
**Are your products not included in the plan? Don't let that stop you; get started yourself. For more information, see the Step-by-step plan (download file) (Dutch | PDF | 188 kB).

Would you also like to participate in existing agreements or are you working on a new partnership?
Please contact your trade association and/or the NAPV network director.
Practical examples
Practical example of chain collaboration
Baker's salt 2.0
"The aim of the ‘Baker's Salt 2.0’ project is to promote the healthiness of bread by reducing the sodium content of bakers' salt and enriching the salt with minerals. To achieve this, NBC (Dutch Bakery Centre) is working with a broad coalition and a clear project structure. To ensure maximum acceptance, we have involved bakers (industrial and artisan), suppliers and millers. The project comprises of a Legislation and Regulations working group, a Taste & Process working group and a Communication working group, each with its own coordinator. Management is carried out by the Steering Committee, which includes the three associations (NBOV, NVB and NEBAFA) that monitor and assess the process, as well as an external advisor with a scientific background in nutrition."
– Frank Janssen, Director of the Dutch Bakery Centre (NBC)
Reformulation
Practical guide to reformulation and innovation
"We believe that the healthy choice should be the easy choice. However, the path to healthier options can be challenging. To address common barriers, we have created the Practical Guide to Reformulation and Innovation (opens new window). This freely available practical guide is designed to help professionals define and implement reformulation strategies. It provides insight on the impact of changes in crucial product characteristics such as taste, texture and overall experience. The guide supports informed decision-making to improve the healthiness of products without compromising quality."
– Vera Hoynck van Papendrecht, Programme Manager Food & Health at Foodvalley
Product improvement platform
This landing page is the result of a collaboration between project partners from all relevant sectors to share information, sector agreements and inspiring examples of product improvement.

Contact
NAPV network director and VWS
Maud Theelen has been commissioned by the Ministry of Health, Welfare and Sport to activate companies and industries, connect and support them with the NAPV and assist in making joint NAPV agreements. Please contact her at napv@productverbetering.nl
Foodvalley
For questions about product improvement that go beyond the realisation of NAPV agreements (e.g. about innovation, consumer behaviour, entrepreneurship, supply chain collaboration and the sharing of production facilities and knowledge), please contact the Healthier Food Community (opens new window)of Foodvalley.
Nutrition Centre
For access to the Manufacturers' Portal or questions about submitting data to the LEDA, please send an email to levensmiddelendatabank@voedingscentrum.nl
RIVM
Do you have questions about the product group classification or the NAPV methodology? Please send an email to the RIVM helpdesk: productverbetering@rivm.nl
More information
NAPV system/ threshold values
For the food service and catering industry
Miscellaneous
Every step counts
Working together towards an improved product composition in 2030.